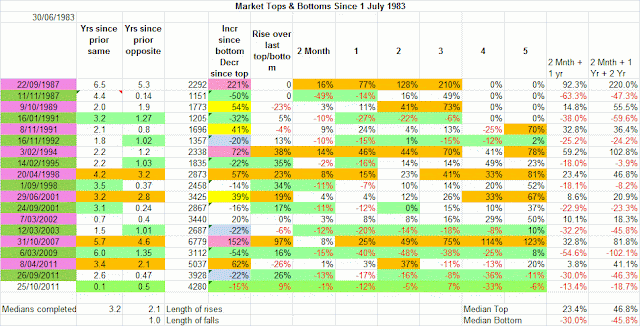
While I have previously posted on market Tops and Bottoms as separate entities, this post shows the cycles of tops and bottoms in one table in chronological order.
Explanation of the use of the lengths of cycles and rates of growth over different time periods have been given in the last post about the Characteristics of Market Bottoms and very similar principles apply to market tops.
The only additional word of caution is regarding the possibility that we are in a long term secular bear market and so falls might be longer lasting and bigger and bull rallies shorter and lesser, but this is just a caution about a real possibility, not a prediction.
The last line is today's results and it will not be a major turning point (famous last words?) unless Europe falls apart over the next few days.
The greens and blues are buys, the pink, yellow and orange are sells. you will see from the last two columns that tops are all large rises (because we are adding together the growth for 2 or 3 periods) and the bottoms are all large falls (for the same reason).
You will see that all bottoms have falls for 2 months and 1 year and generally for 2 years also, while almost all tops have positive growth for all periodicities with only a few exceptions, including in April 2011. Only 2 tops out of 7 have any negative growth period. It is uncommon to see a top without all periodicities showing positive growth.
The median lengths of complete cycles, rises and falls are at the bottom of the table as are the median results of adding each of :
a) 2 month and 1 year, and
b) 2 months and 1 and 2 years growth
for tops and separately for bottoms.
Median cycle is 3.2 years, median rise is 2.1 years, median fall is 1.0 years.
In about 1974 Austin Donnelly's book on Charting for Profit indicated that cycles averaged about 4 years, so things haven't changed that much, particularly if my 2 sub 20% fall bottoms were excluded, as most people would do in an article on market cycles.
Because of the occasional fast dramatic fall like 1987's 50% in 50 days with some trend indicating strategies failing to initiate a SELL until most of the loss was over, you may wish to have a stop loss at say 7 to 8% fall from the current bull market high. A tighter loss will result in more whipsawing and resultant losses over the round trip (Sell/Buy)
When looking at market bottoms, you may also like to consider the likely maximum fall in terms of the previous 1 or two rises. The largest falls often occur after the most extraordinary rises like the 1987 and 2007 tops.
Should I "pick the bottom"?
You may choose to to invest at a time when the market:
a) is grossly oversold compared to eg its 200 SMA,
b) has had a fall of say 9% over the last 2 months (all bottoms except 1995 met this criteria), and
c) has fallen more than say 114%
on the basis that you will lose recovery of say 10% of the value at the top when the market turns up while you await the emergence of an apparently sustainable uptrend and so will get in closer to the bottom with this bottom picking strategy than by waiting for the uptrend to establish. You would likely be more cautious and adjust the above parameters if the preceding bull market was longer than usual, had a higher percentage rise than most bull markets and a higher rise in percent per annum terms.
For those interested in avoiding major falls but participating in major rises, this information should be helpful.
I add my usual cautions about the Japanese possibility which would change all these things and also of the dangers and costs of being whipsawn.

No comments:
Post a Comment